Monday 10 November 2014

links

https://cognoswithhari.wordpress.com/

http://www.howtocognos.com/blogs/
http://www.envisn.com/envisn-cognos-blog/
http://sebastianmai.blogspot.in/
http://cognospaul.com/
http://cognos-tutorials.blogspot.in/
http://cognosteacher.blogspot.in/
http://cognosknowhow.blogspot.in/
http://cognosknowhow.blogspot.in/search/label/.%20LIST%20OF%20ALL%20POSTS
http://cognosasksumeet.blogspot.in

http://www.ibm.com/developerworks/data/library/cognos/upgrade_and_migration/bi/page523.html

Creating Dimensionally modelled Relational (DMR) Model Design:


Framework Manager Advanced Working with Prompts and Session Parameters, Framework Session Parameters


This a very useful link which I got it for Active reporting. If you ppl have any other good website for Active reporting please share.


You have a link mhtml file in the following link which will be more useful.

http://www.ibm.com/developerworks/apps/download/index.jsp?contentid=766549&filename=IBM_Cognos_Active_Report_Cookbook.zip&method=http&locale


http://bicorner.com/

Thursday 6 November 2014

Active Report

An Active Report is a means of delivering interactivity in a report without having to maintain a connection to your cognos server. This is achieved by including report data in the report output. There are obviously advantages and disadvantages to this. The advantages are that you can use the report remotely, and not have to rely on maintaining a network connection. The disadvantages are that there is a finite amount of data you would want to add in to the report - or else you risk it becoming an unmanageable monster.

Active Reports are best suited to high-level summarised data, and probably no more than (say) 10Mb in total. Otherwise you might have issues with email attachment limitations, mailbox sizes and network transfer speeds.
All of the existing report distribution channels, including scheduling and bursting, can be employed to circulate Active reports across large user communities.

In order to allow for consumption outside of Cognos Viewer, the reports are rendered in a MHTML (sometimes referred to MHT) format consumable by all standard browsers (Firefox will require an extension to be installed). In order to allow for offline interactivity by the end user, all the data that may be viewed by the end user through report prompts must be stored in the output file.
Active reports open in a standard browser window there by eliminating the need for Cognos Connection, third party or programmatic access to Cognos viewer. In addition, the entire data set needed to support the report is published in the self contained MHT file. This eliminates the need to interact with larger and potentially slower data sources and provides rapid performance for small and medium sized reports (more on this later).

Are there any Red Flags with IBM Cognos 10 Active Reports?
The first point of consideration should be that of security
Amount of data necessary to support the report grows, there will be a corresponding increase in the file size and a decrease in the responsiveness of the report.

Due to the fact that there is no charting engine available once the report has been saved as an MHT file, it is necessary for the report to hold a pre-rendered view of each chart view a user may request. This can of course lead to very large report files again impacting performance.
 

Monday 18 August 2014

Impact of Sumary Filters on reports

Consider the following columns in your report: Product, Sales and Rank - Rank(Sales).

To display only top 5 products you create a summary filter where Rank < 5.

Scenario 1: No grouping in report, no scope in summary filter
Result: No filtering effect

Scenario 2: Product grouping in report, no scope in summary filter
Result: No filtering effect

Scenario 3: Rank grouping in report, no scope in summary filter
Result: Filtering effect

Scenario 4: Product grouping in report, Product scope in summary filter
Result: Filtering effect, validation warning

Scenario 5: Rank grouping in report, Rank scope in summary filter
Result: Filtering effect, validation warning

Scenario 6: Product Grouping in report, Rank expression changed to include for Product, no scope in summary filter
Result : Filtering Effect

Scenario 7: Product Grouping in report, Rank expression changed to include for Product, A summary calculation - max - maximum(Rank) included for Product Grouping level, summary filter changed to max < 5, set scope of this filter to Product then only those groups that have maximmum ranks of 5 are displayed. Not setting scope will result in no data.

A summary filter should hence be used only when groups need to be filtered out otherwise an after aggregation filter should be used.

Impact of Summary Filters on Reports - Part 2
This is in continuation to the post on Impact of Summary Filters on Reports.

Scenario 8: No grouping in report, no scope in summary filter, Rank Data Item's Rollup is set to None
Result: Filtering effect

Scenario 9: Include Sales, Product in Query 1. In Query 2 reference Query 1's Product and Sales and create Rank Data Item in Query 2 and summary filter in Query 2. No scope for summary filter, no grouping in report.

Result: Filtering effect

If you notice the query, the difference between setting Rank Data Item's Rollup to Automatic and None is as shown below:


Automatic -
(rank() over ( at XSUM(Order_details8.Revenue ) order by XSUM(Order_details8.Revenue ) desc nulls last ) < 5)


None -
(rank() over ( at Order_header6.ORDER_NUMBER,Product7.PRODUCT_NAME order by XSUM(Order_details8.Revenue for Order_header6.ORDER_NUMBER,Product7.PRODUCT_NAME ) desc nulls last ) < 5)

Here's my understanding -

Any summary filter works on the principle of After Auto Aggregaion / Rollup Aggregation. Hence Rollup aggregation of Rank is taken into consideration as Rank is used in summary filter. By setting this rollup to None, we are specifiying that no rollup aggregations need to be applied to this data item as well as objects inside of this data item. Hence whatever Rank function was applied inside of the detail query is applied at the rollup level as well.

This is a litle confusing to explain. But hope atleast I was able to throw light on the fact that summary filters are similar to rollup calculations or have an impact on rollup calculations.

List vs Chart


Have you ever noticed that a list report and a chart report behave differently when it comes to querying. I found that out fairly recently. Let me give you an example of how differently the two work. Assume you are to display for each selected Month the Top Products by Sales along with the monthly % contribution towards the sales. Ideally you would drag Product, Month, Sales, Rank(Sales for Month), Total(Sales for Month) - This is the total sales for the top products, % Contribution being - Sales / Total (Sales for Month) - basically how much did this Product contribution towards the total sales. I have a rank filter - rank < = 5 with after auto aggregation property set.

Now when I drag Product, Month, and % Contribution into my Chart report and List report, I see that the values are different. The list report displays the expected value while the chart report doesn't. On closer look I notice that the chart report doesn't apply the rank prior to the calculation of Total (Sales for Month). This means that my chart is calculating the total sales across all products for the month rather than Total sales for the Top 5 products.

Now that is weird when the List and chart behave differently. To work around this, I had to create a subquery which gets me the Product, Month, Sales and Rank with filter Rank < = 5. On top of this query I have another query that does the % contribution calculation. Now the list and chart work perfectly.

In retrospection I think the chart was working as expected, the rank filter was getting applied after aggregation. It was the list that wasn't working fine even though it returned the data I required.

The point though that I would like to make here is that not always lists and charts work the same way or fire the same query.

Lists and Crosstabs
Lists and Crosstabs work differently with DMR. My requirement is to allow the user to select any member from the Product Hierarchy and the report should display the members in the selected level along with the children of each such member and the corresponding revenue.

Basically if the user selects any Product Line then the report should display Product Line, Product Type and Revenue or if the user selects any Product Type then the report should display Product Type, Product and Revenue.

I have created 2 data items for the same -

Parent - members(level([great_outdoors_company].[Products].[Products] -> ?Parent?))
Child - descendants([Parent],1)

and included Revenue measure.

When I drag the same into the crosstab the results are perfect while a list report based on the same query results in no data.

Has anyone else come across this issue?

[Update] The same can be achieved in List by creating the expressions using a Calculated Member rather than a Query Calculation. This feature is available 8.2 onwards.

InScope Report Function

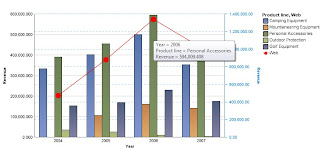
How do you display a measure with different data formats against different Series elements in a chart? This is where conditional style and InScope report function comes to the rescue.

Requirement: Display a chart with Revenue measured against Product Line members in the primary axis and against web Order Method against the secondary axis. Display Revenue with 3 decimal places against Product Lines and 2 decimal places against Web order method.

This requirement can be extended to display different data formats against different series members.

Solution:

Step 1: Create the chart with Revenue as the default measure, Product Line dragged into Primary Series and Web Order Method dragged into Secondary Series and Year dragged into Categories.

Step 2: Select Revenue and create an advanced conditional style with the expression as InScope(Web)

Set the format in the style properties for this condition.


Likewise create another advanced condition for Product Line.


Business Insight

Business Insight - Limitations
A lot has been said and written about Business Insight. While you will come across a lot of articles highlighting the good, jazzy and the positive features of Business Insight, I wanted to focus on some limitations in the use of Business Insight.

Business Insight being a new technology/component from IBM, it has a lot of bugs that need to be fixed before we can benefit from the use of Insight. Most of these bugs that I have come across have to do with drill ups/downs. I consider these to be really important issues to be addressed as the primary shift in datasources is from relational to dimensional. The issues have been listed out in the article:

Another big drawback that I find is with respect to prompts. Though Slider and Check-box List prompts are available, Insight lacks the availabilty of value prompts, date prompts. These need to be created inside of reports and users need to drag them into the Insight reports to make use of them. Value prompts when dragged into Insight are not jazzy enough to blend with the other components on the screen.

Non Auto-Submit Value prompts when dragged into Insight cause individual Apply/Cancel buttons to appear for each such prompt.

The available Slider and List Box prompt has another disadvantage. When these prompts are set inside Insight, users need to select a list of values that need to appear in the prompts. Though this makes sense when you think of Insight as an ad-hoc tool, how often do you come across users who are willing to spend a few minutes to create an ad-hoc dashboard. More often than not, the requirement is to have pre-authored dashboards and in such cases this limitation is huge. New values don't show up unless the user goes in and modifies the prompts each time.

Another disappointment is you cannot convert the whole dashboard into different formats. You can only convert individual widget into various formats. So much for being able to take a snapshot of your dashboard.

Even though Insight was meant to be an ad-hoc dashboard environment but gone are the days when dashboards were static. Users require ability to slice and dice their key metrics data. With the line between Dashboards and Reports are getting blurred at some places it would be great to have more prompting capability in Insight.

Insight is a CPU intensive tool. Heavy dashboards can take a while to render.

Having dished out about Insight limitations, I need to say, I really liked the slider feature. Wish we had such components available in RS. It would be great to have some of the jazzy looking Active Report Prompt components also available in RS.

Business Insight Bugs 10.1.1
Some Business Insight bugs discovered in Cognos 10.1.1 version:

  • Data formats and formats like Background colors, Fonts, borders not maintained after drill up/down.
  • Drilling up on an object containing a single member brings back sibling members rather than parent members.
  • Nested Metrics in crosstab columns lost on Drill up/down.
  • Prompts not reflected on report objects after Drill up/down.
  • Layout calculations in crosstabs lost on drill up/down.

IBM Cognos Insight

IBM recently released a new component IBM Cognos Insight bundled with TM1 10. This is not related to Business Insight and is a separate Dashboarding component.

The tool seems to be more inclined to supporting TM1 10 and has an in-memory analytic engine with write-back capabilities. Visually too this looks so much better than our Business Insight.

But as always with any new release there are bound to be disappointments so the wish list here too is huge.

To add on to what has been mentioned in the previous article, this new component from IBM allows users to pull in data from a number of sources and not just TM1 as I had wrongly assumed.

From a licensing perspective this requires Advanced Business Author role or above for BI and TM1 contributor role or above for TM1. The tool integrates with Cognos 10.1.1 and TM1 10.1.

Here's what else I could find on IBM site:

You have all the capabilities of the Insight Standard Edition plus:
• Import data from existing Cognos reports
• Share files using the Cognos Connection portal
• Publish and distribute content to the server for managed deployment
• Extend content created with Insight to other Cognos tools and interfaces like mobile and Web
• Use Insight as the interface to contribute to a managed planning process


Since this is a stand-alone desktop tool, I am curious as to how it fits architecturally with other Cognos components and how requests are executed. Since it supports in-memory analysis is this in-memory analysis handled on BI server or on the client machine? And if it uses a TM1 engine behind the scenes, how do requests flow when reports are used as sources?

Bursting

Bursting Explained - Part I
I have been asked by so many users what happens behind the scenes when Cognos bursts a report? Why do burst reports take longer to complete? etc. And I have explained about master-detail relationships and its impact on Burst reports in an earlier post. In this post and the next couple of posts I am going to try and cover the various burst scenarios and how many SQLs Cognos fires against the backend in each scenario.

Bursting is made up of 3 components:

The Burst Query or Report Query: The report query that needs to be burst. The report could be a single query report or multi-query report. In case of a multi-query report, each data container in the report needs to have a master-detail relationship set up with the burst group query.


The Burst Group Query: The query that decides the burst group. For each record in the burst group query the report is sliced.
Example: A report needs to be burst for each Sales Regions. In this case the burst group would be the Sales Region. The report is sliced for each Sales Region record generated by the burst group query.


The Burst Recipient Query: The query that provides the recipient information.


Scenario 1: A single Burst Query, Burst Group Query, Burst Recipient Query.

In this case the list in the report, the burst group and the burst recipient information is fed by a single query.

Example: Burst a Sales report based on Sales Regions to be made available to users through Cognos Connection Directory.

Query 1 Data Items: Year, Sales Region, Sales, Recipient.

Recipient - CAMID('Everyone')

In the above Example, since burst group, burst recipient and list report are sourced from a single query, Cognos runs this query once, retrieves the entire data set and then slices the report output for the various sales regions. Hence only 1 query is fired by Cognos in this case.

Bursting Explained - Part II
Link to Part I, Part III.

Scenario 2: A single Burst Group and Burst Recipient Query but multiple report queries.

In this case the report has multiple queries. The burst group and burst recipient information is fed by a single query.

Example: Burst a Sales report that has 2 lists based on Sales Regions and make the report available to users through Cognos Connection Directories.


RecipientQuery (Master Query) - Sales Region, Recipient

ListQuery1 (List Query 1) - Year, Sales Region, Revenue

ListQuery2 (List Query 2) - Year, Sales Region, Sales Target

You would need to create master-detail relationships between the Master Query and the 2 List queries. The Burst Group and Recipient query would be the master query.


In the above example, since the burst group and burst recipient is sourced from a single query, this query is run once before the start of bursting process. Then for each record retrieved by the burst query the detail queries are fired once each.

Say we have 100 sales regions. The master query is fired once and the 100 records are retrieved. Then for each Sales region the 2 detail queries are fired. So you would see a total of 2 * 100 queries fired against the DB in sequence.

It is in the above scenario that you would see the entire burst process taking time to complete. Assume each report output is generated in 1 minute. The entire burst process in the above example is completed in 100 minutes and that is like more than an hour.

Bursting Explained - Part III
Links to Part I, Part II.

Scenario 3: Separate Burst Group, Burst Recipient and Report Queries.

In this case all 3 queries are separate.

Example: Burst a Sales report based on Sales Regions that has 2 lists in them and make all the sales reports available to all users through Cognos Connection Directories.

BurstGroupQuery (Master Burst Group Query) - Sales Region

ListQuery1 (Detail List Query 1) - Year, Sales Region, Revenue

ListQuery2 (Detail List Query 2) - Year, Sales Region, Sales Target


RecipientQuery (Detail Recipient Query) - Sales Region, Recipient

Create Master-Detail Relationships between Master Burst Group query and Detail List Queries. Create Master-Detail Relationship between Master Burst Group query and Detail Recipient Query.


In this example the master burst group query is run once, the data set is retrieved, for each record retrieved the recipient query is run once and the data set is retrieved. Again, for the master query the detail list queries are run once each for each record and data is retrieved.


Defect - Burst Report Views through Event Studio
With 10.1.1 developers no longer see the "Burst Report" checkbox when trying to burst report views through Event Studio.

Create Jobs to burst report views and then use the Job inside of Event Studio to work around this.